Chapter 5 Results
5.1 Custom Time-Series Dygraphs
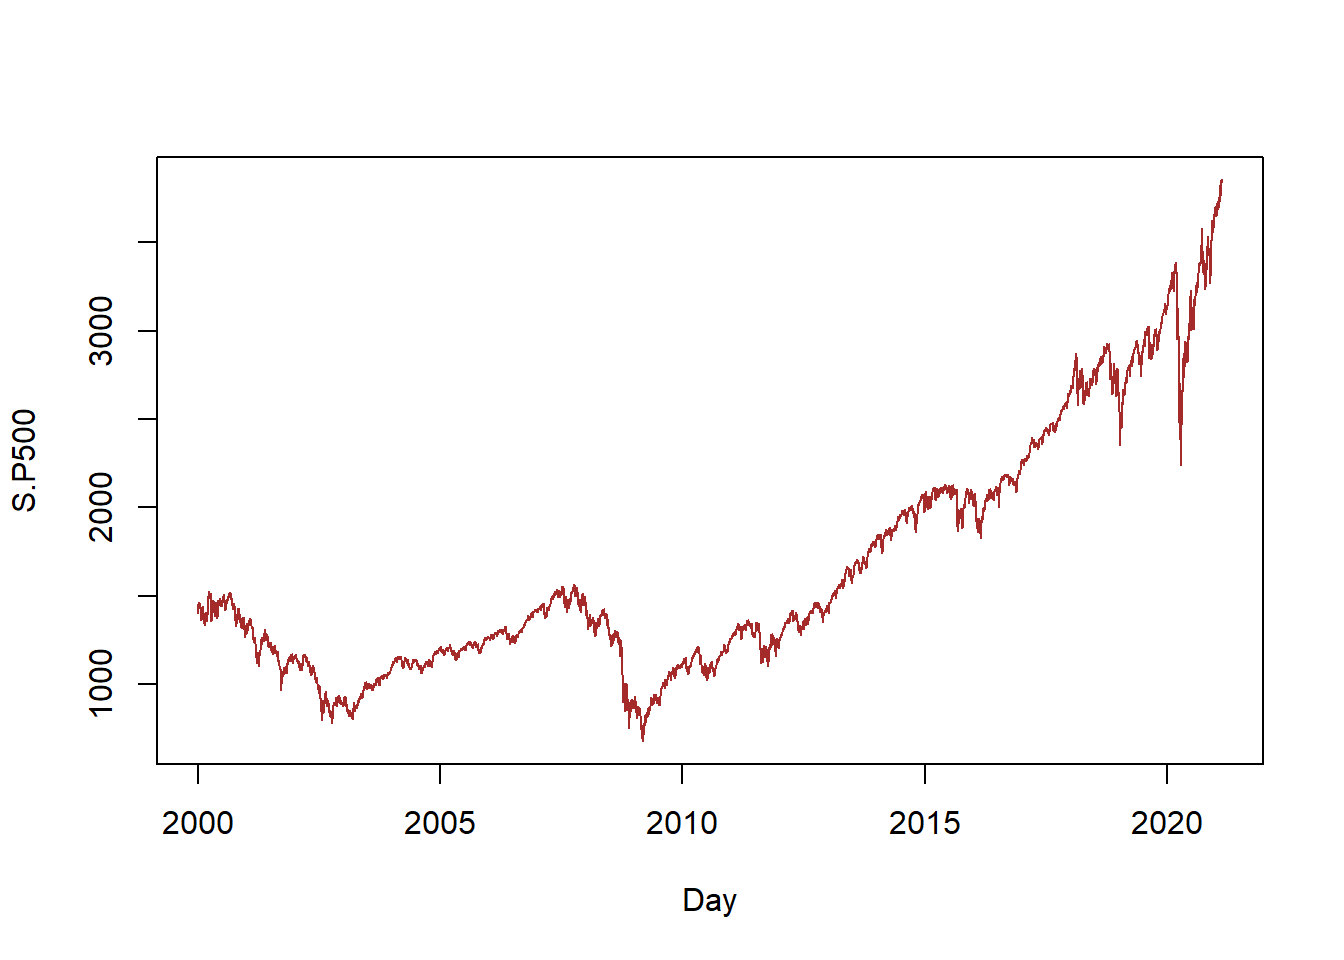
As shown on the plot, the S&P 500 Indexes have generally followed similar trend because they have similar components. The most notable trend would be the steep decline in 2008 followed by the financial crisis and in 2020 because of the effect of the coronavirus on the economy. Besides these temporary declines, the two stock indexes have grown at a reasonable rate throughout the years.
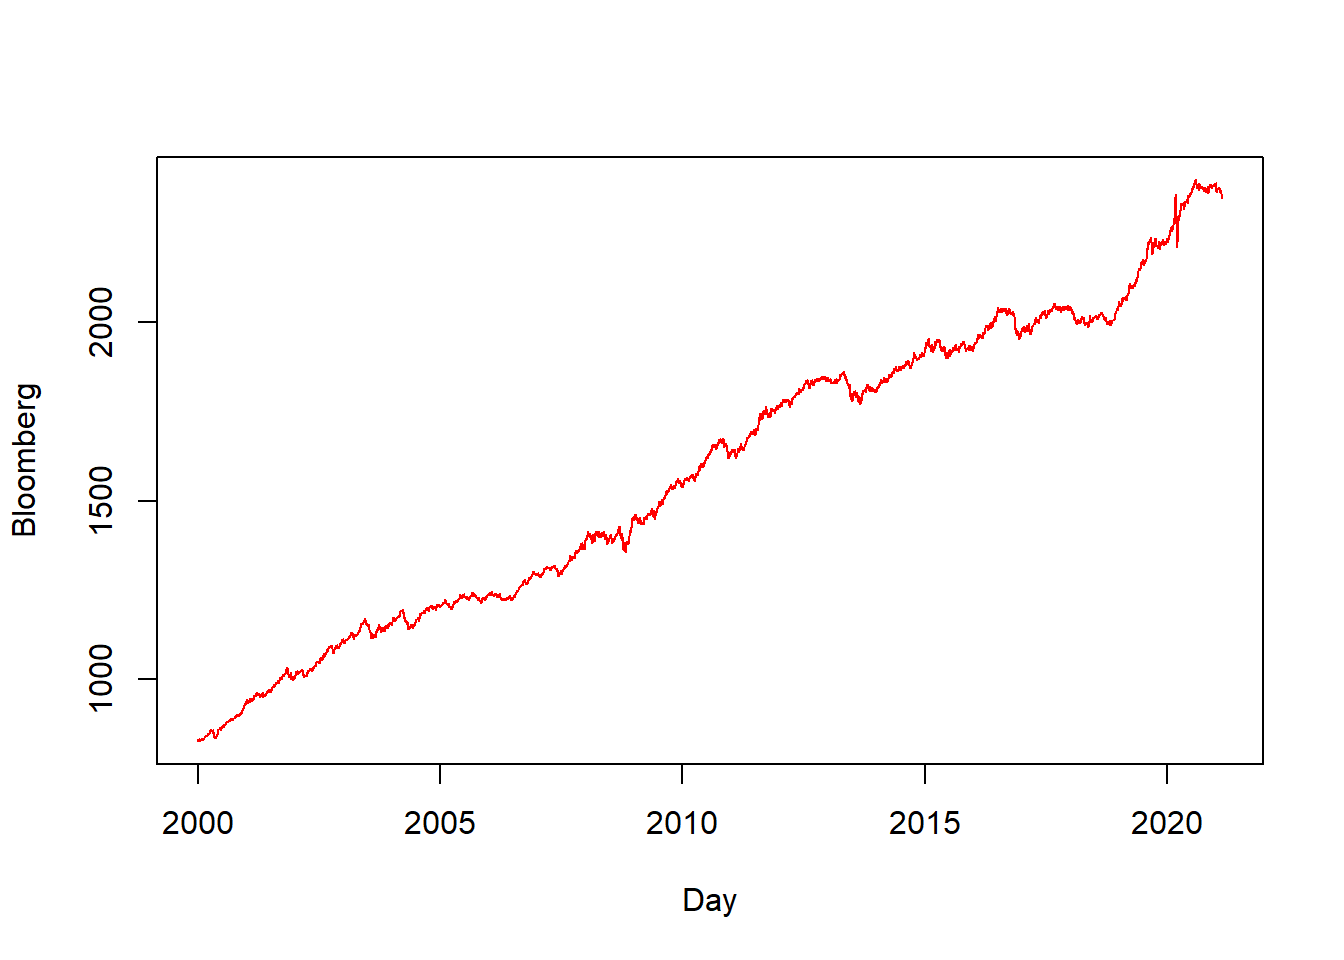
As shown on the plot, the performance of our Bond index has been steadily improving over the past 20 years at a slow pace, as is the trait of this particular investment, offering stable but limited returns.
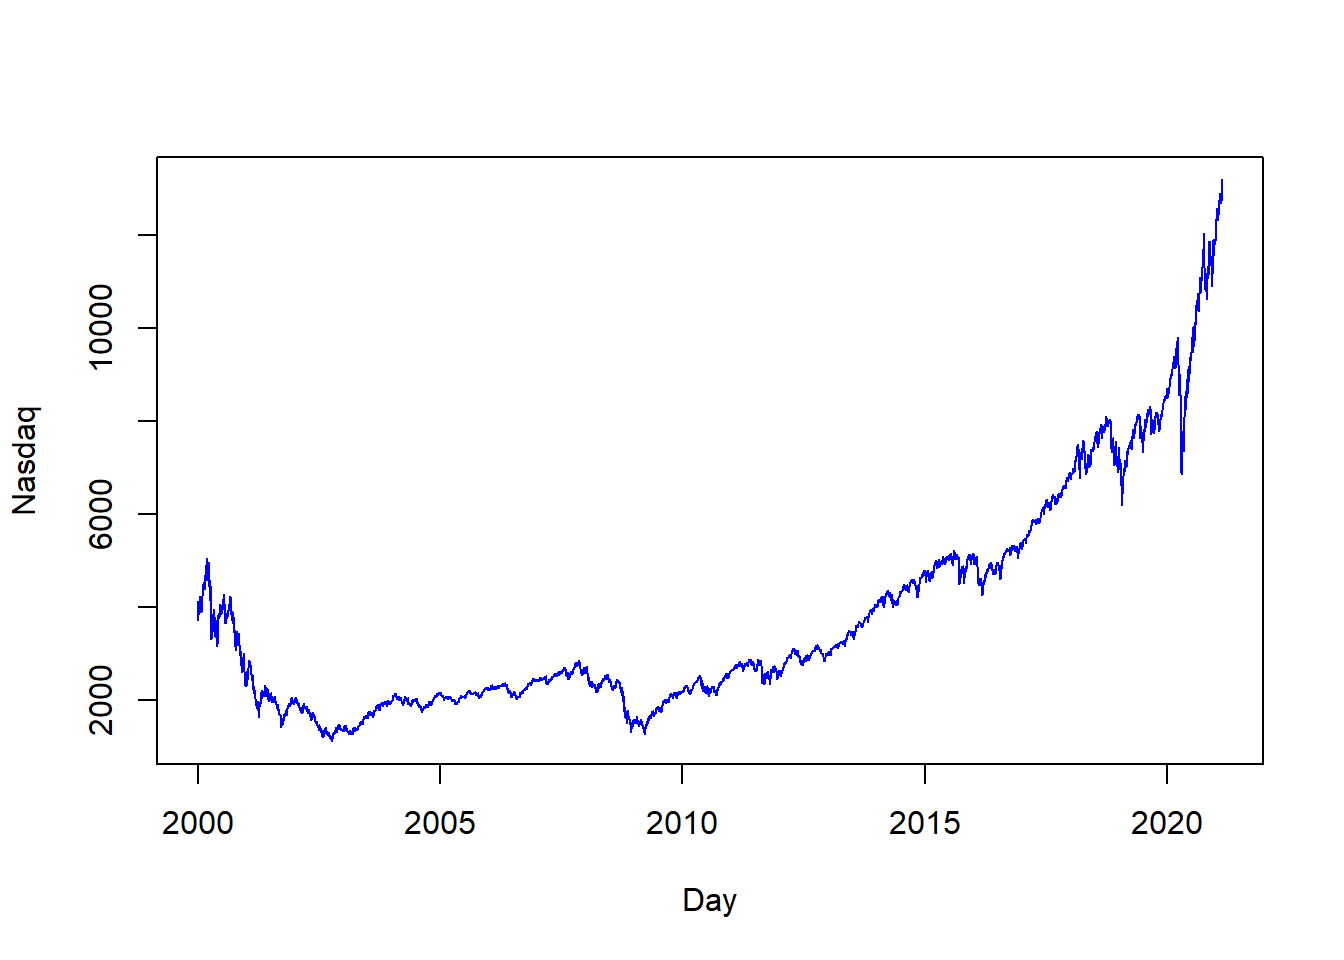
As shown on the plot, the Nasdaq Composite Index slowly declined from a short-term high at around 2000 followed by the burst of the Internet Bubble, started to recover at around 2003, then plummeted at 2008 because of the financial crisis, and finally started this drastic increase in value since recently prompted by the rapid development of the American technology industry.
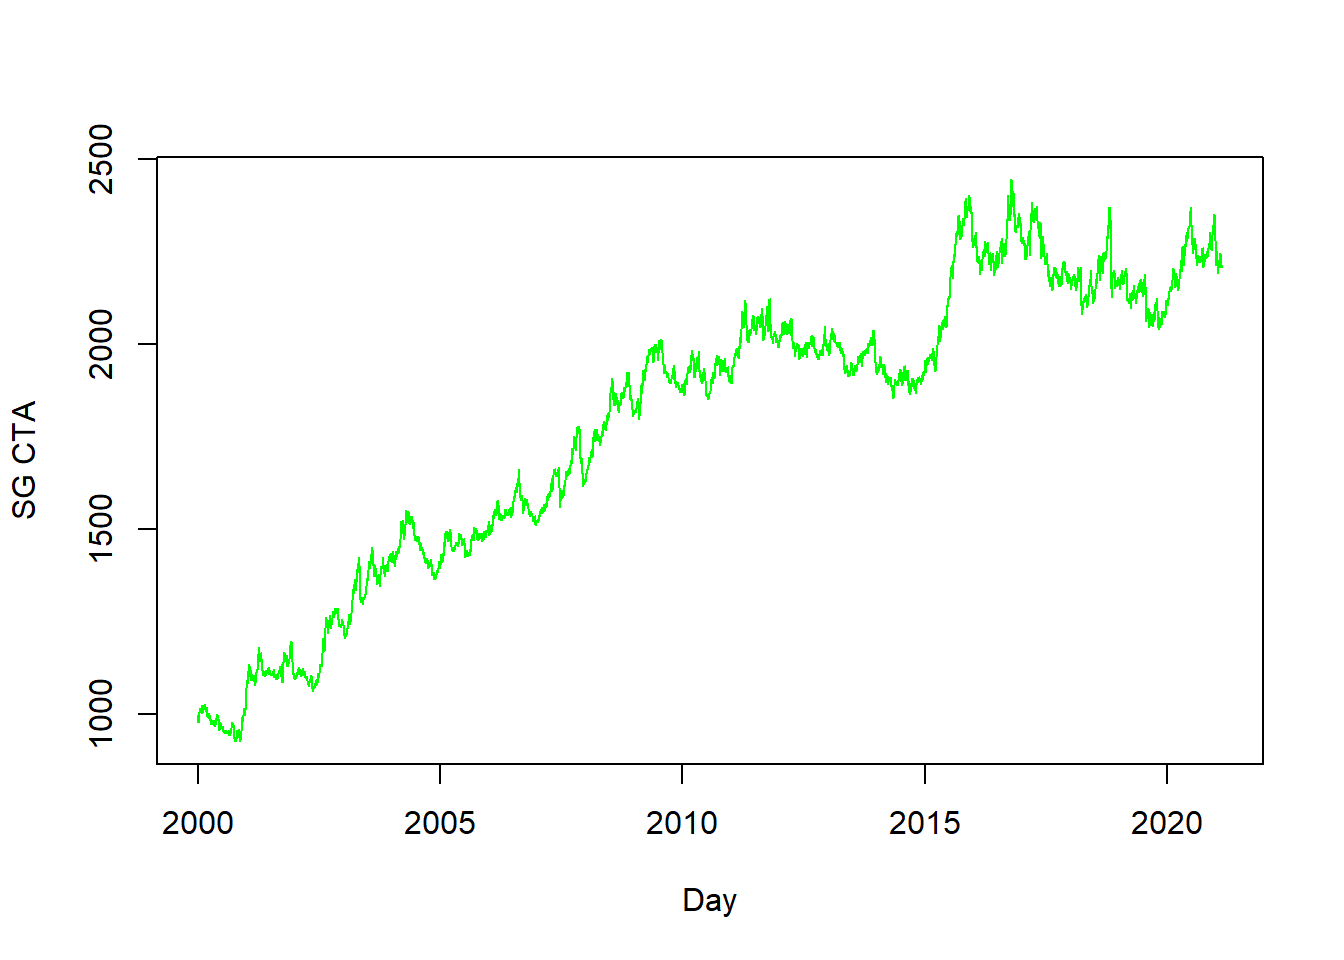
As shown on the plot, interestingly, we have found out that the CTA Index was able to remain intact in 2008 and the effect of the financial crisis was minimal on this particular strategy. It has grown rapidly as more funds begun to adapt this strategy as a profit booster and risk control mechanism. It had its own low point at 2015, as the commodity market had an unprecedented catastrophe, as prices for everything, from crude oil to industrial metals such as iron ore and copper, plummeted.
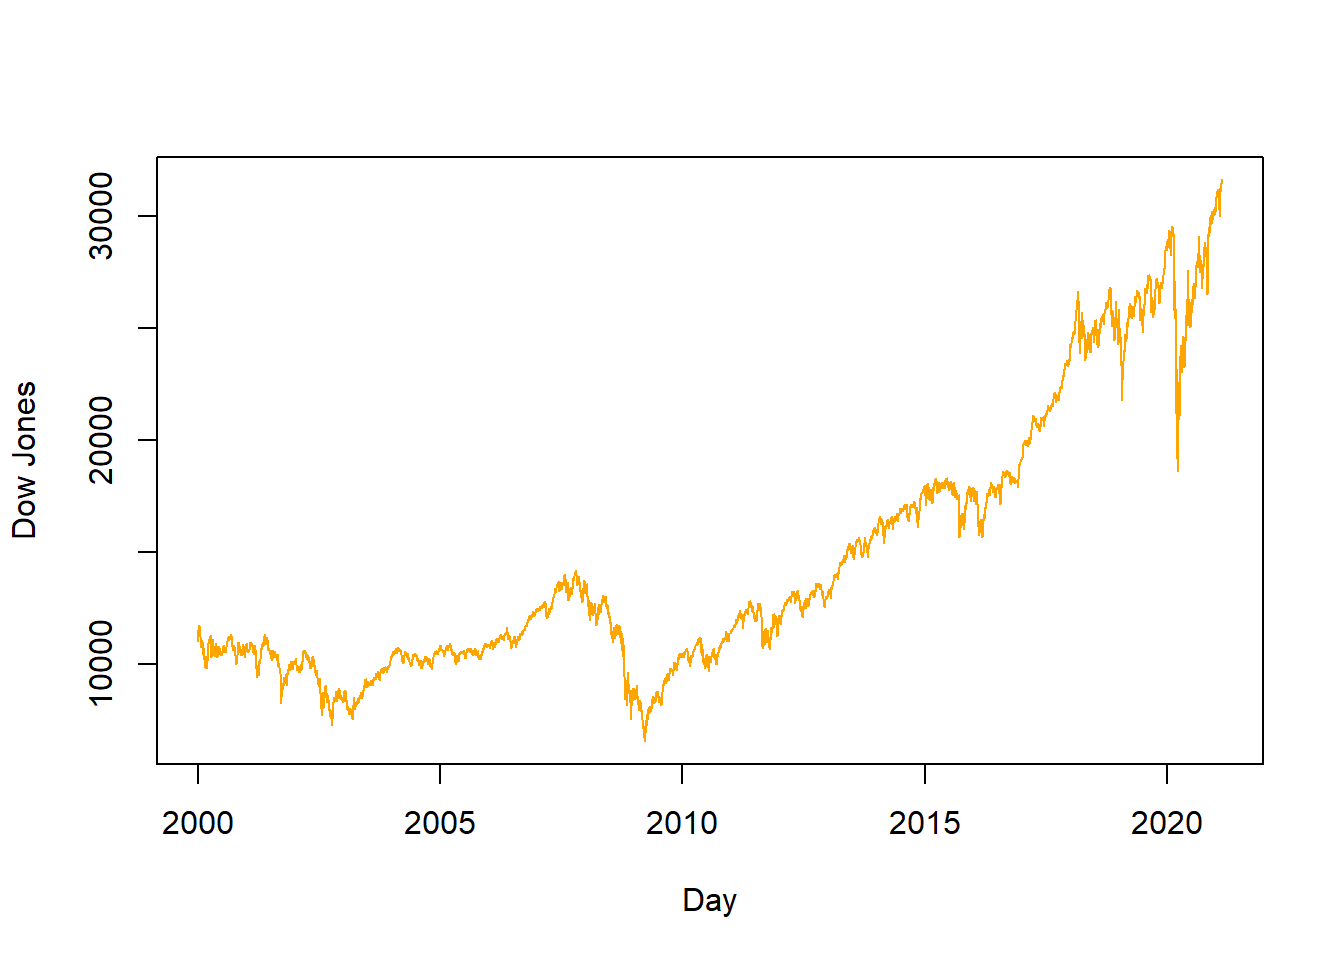
As shown on the plot, the Dow&Jones Industrial Average Indexes have generally followed similar trend because they have similar components. The most notable trend would be the steep decline in 2008 followed by the financial crisis and in 2020 because of the effect of the coronavirus on the economy. Besides these temporary declines, the two stock indexes have grown at a reasonable rate throughout the years.
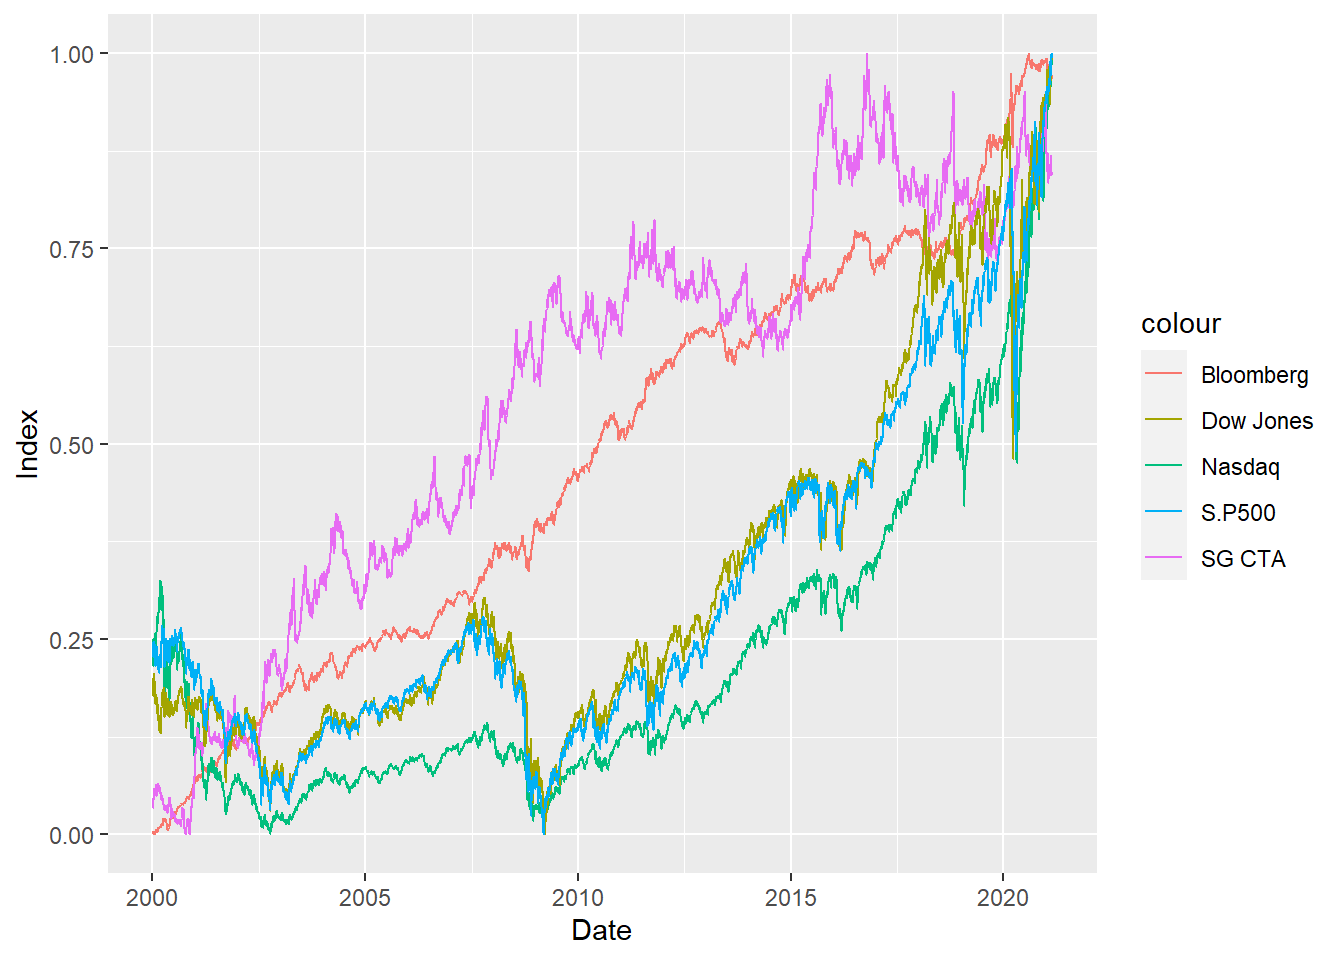
Combining these time series plots together, we have clearly observed that the CTA Index has led the market on investment returns most of the times, and remained unaffected in the financial crisis of 2008, even if it has shown greater volatility than other indexes.
5.2 Times-series Connected Scatterplots
As shown on the plot, the performance of our Bond index has been increasing in a consistent mode. As we can notice, there is a sharp increase of the bond index starting around 2020. Because of the pandemic, the government starts to use expansionary monerary policies, the indexes of bond increase at the faster pace than previous years.
 Everyone says that Nasdaq Index is the reflection of the American financial market. And we can see that it has a sharp decline in the 2008 financial crisis. And after the pandemic in 2020, there is sharp increase because of the rapid increasing market value of the technology companies.
The CTA index is very unique because it is very insensitive to the secondary market. It provided stable returns in the 2008 financial crisis. Because of its rapid falling in 2015, it is clear that it is closely related to the commodity market.
Compared with Nasdaq Index, Dow Jones Index is much more sensitive toward the financial market and the reality world. Not only it has fell sharply in the 2008 financial crisis, but also it has fell in the early 2020 becasue of the pandemic.
If we look between the S&P 500 index and the Dow Jones Index, they are very similar because they basically have similar trends as a reflectio of the society. It shows sharply regarding about what happened in the society.
Nasdaq Index is the reflection of the American financial market. And we can see that it has a sharp decline in the 2008 financial crisis. And the size of the green can imply that how much it has increased since the beginning of the pandemic.
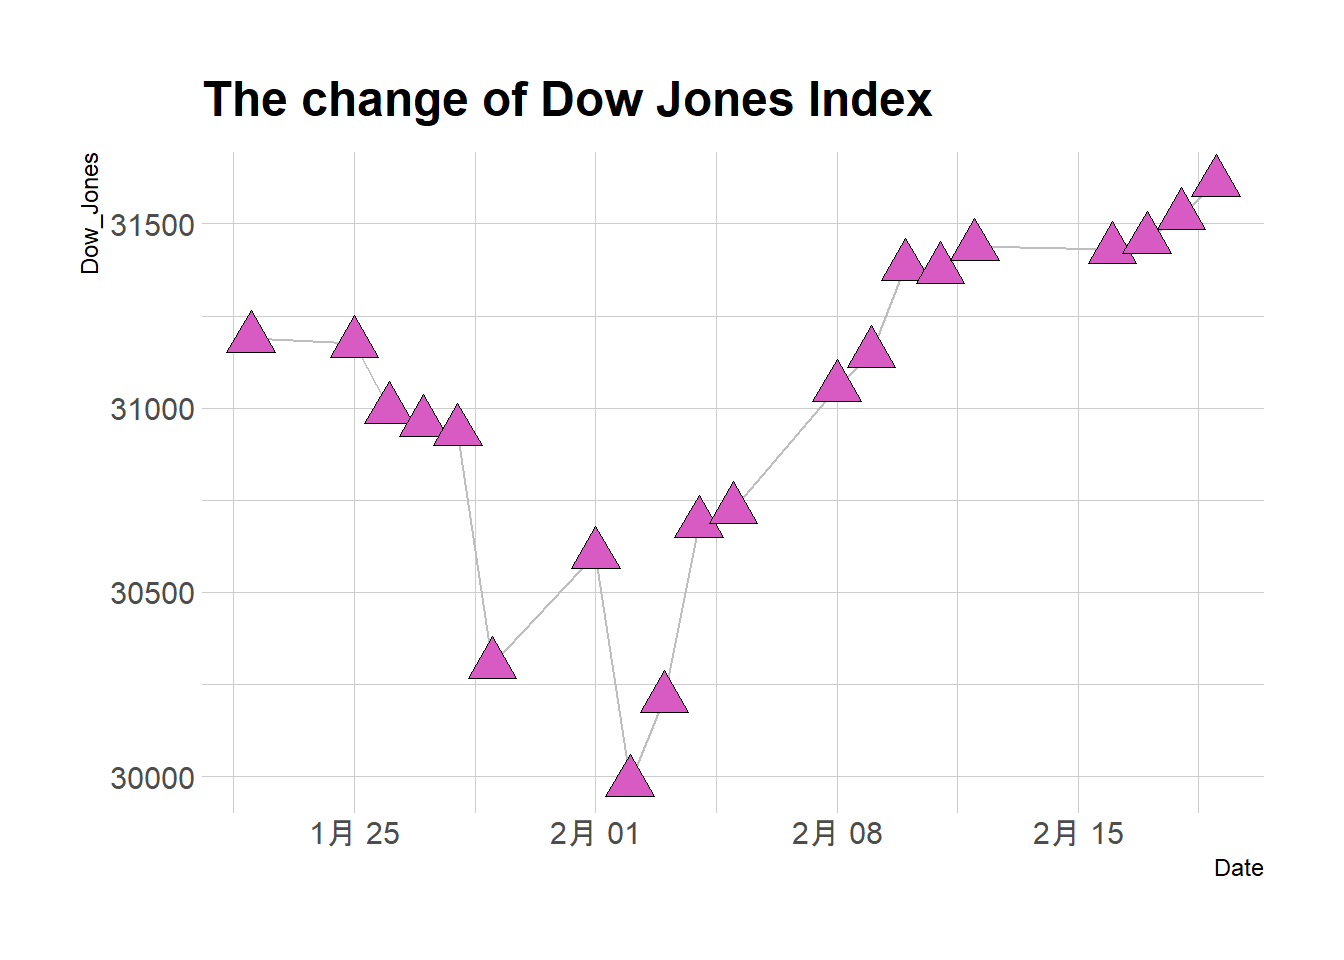
The use of the bullet points can clearly show the change of the index in the relative amount of months.
5.3 Correlation Graphs between different Indexes
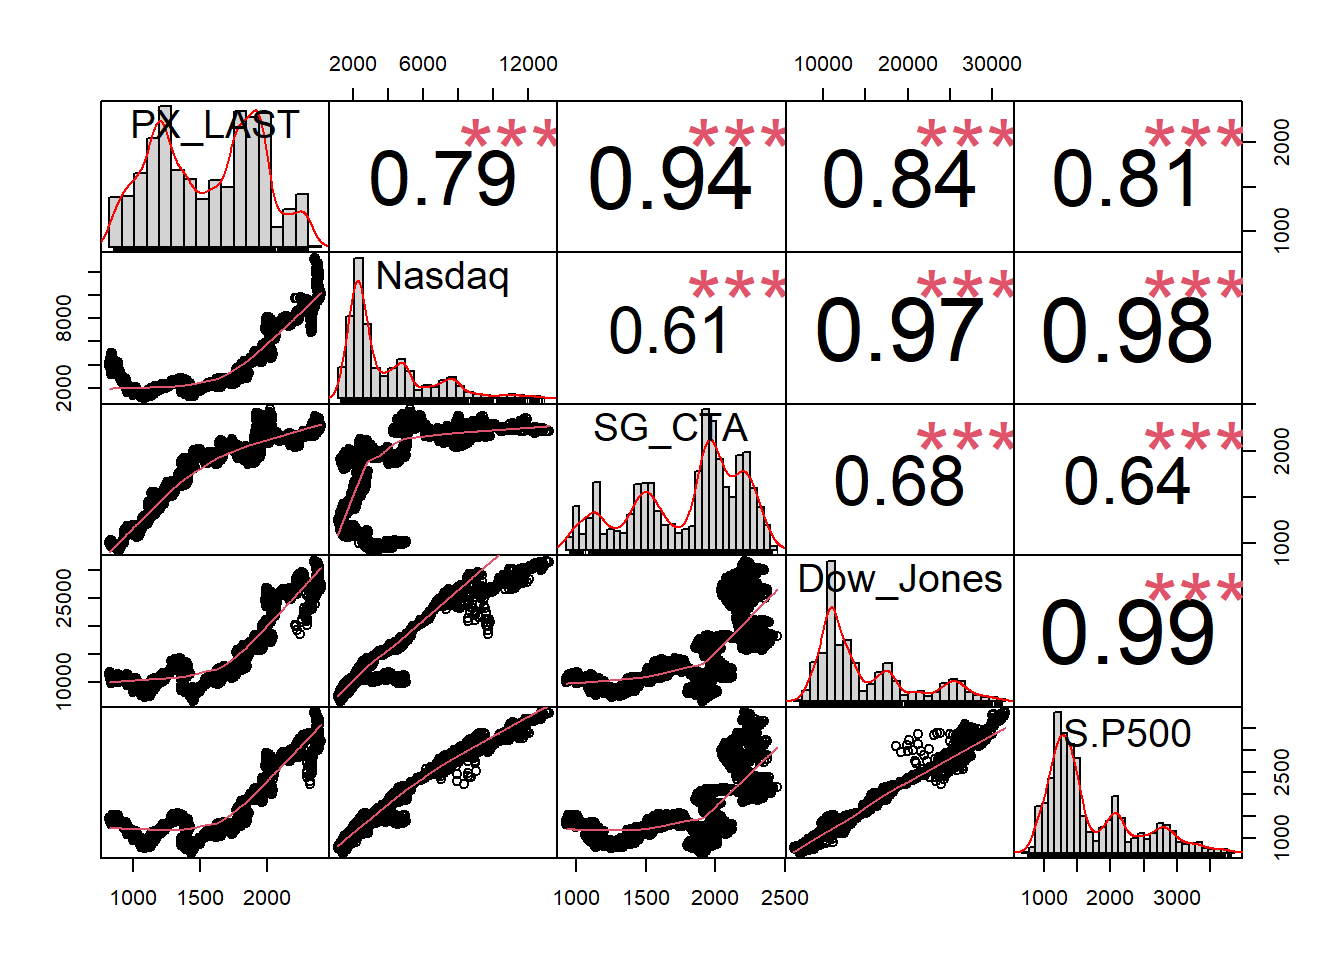 As illustrated in the graph, the three stock indexes, the Nasdaq Composite, Dow & Jones Industrial, and S&P 500 are strongly correlated, as expected because each of them gives a weighted-performance of the stock market with different benchmarks, resulting in a correlation coefficient of almost 1.
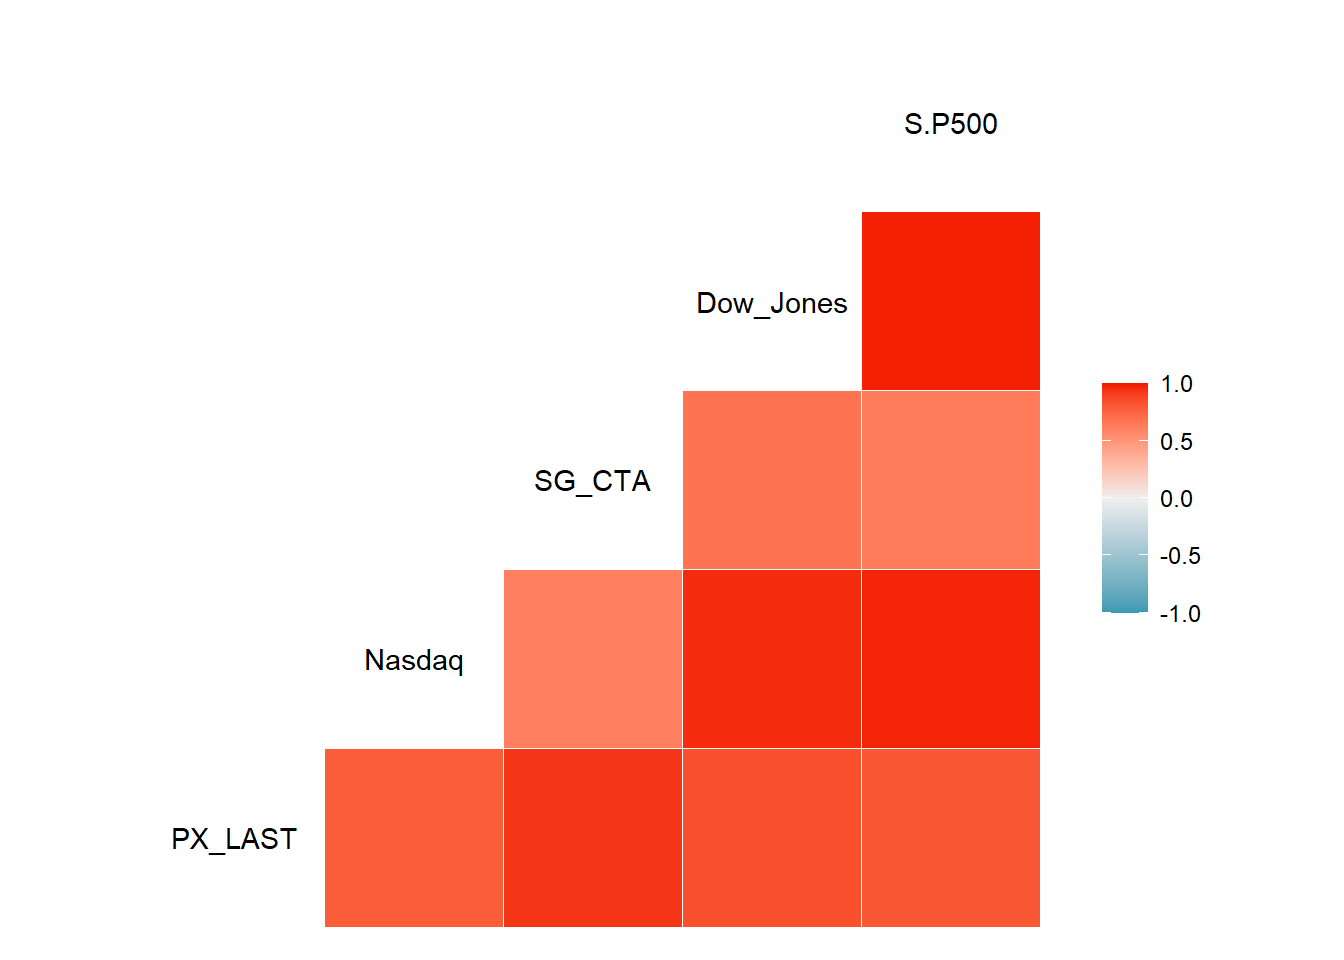 Interestingly, the CTA index showed relatively weaker connections to the stock indexes and the strongest correlation to the Bond index.
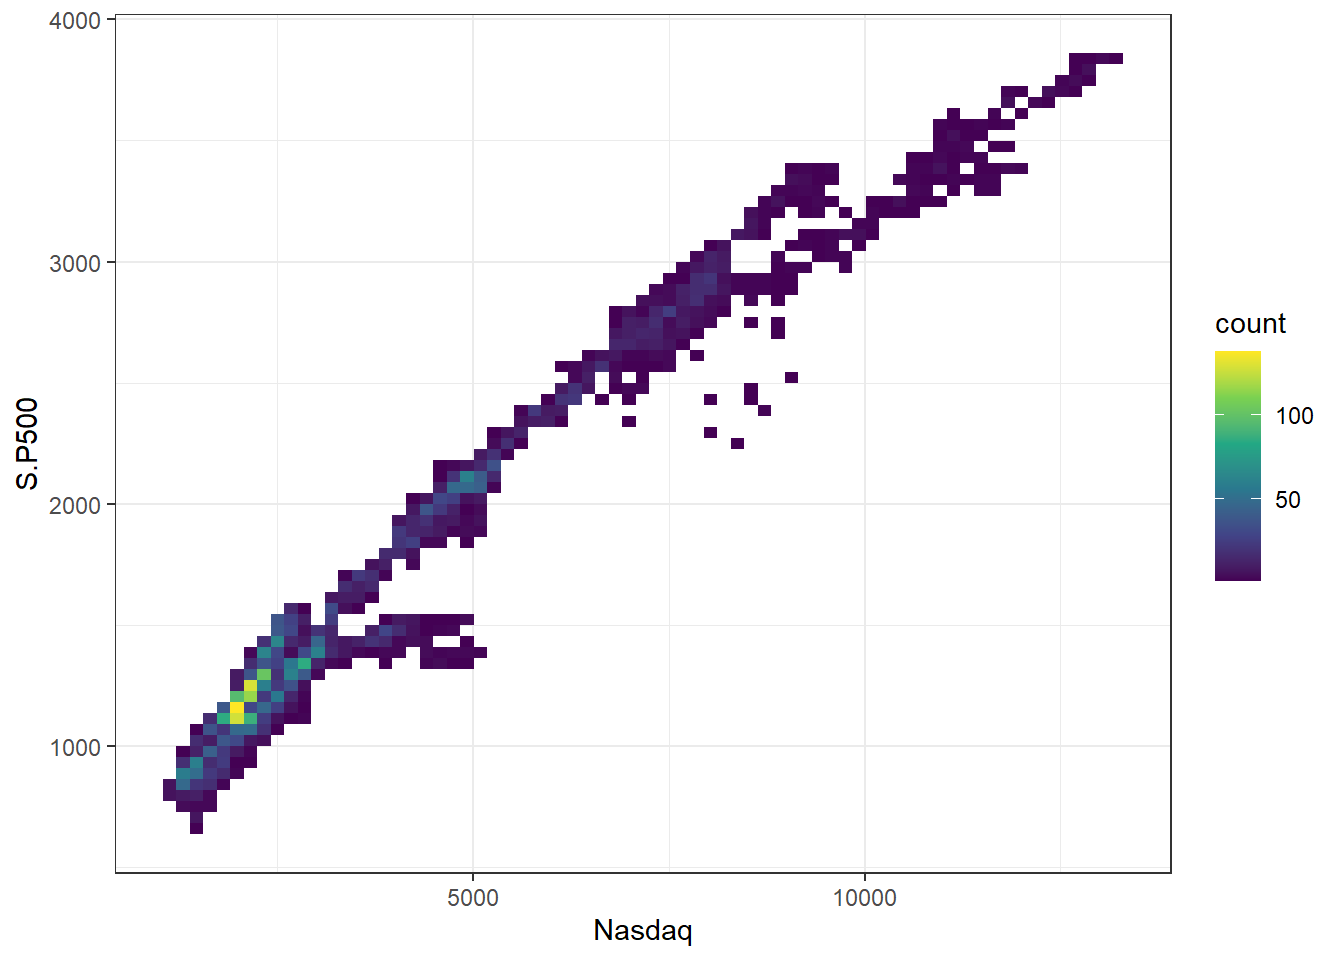
5.4 Relations between different Indexes
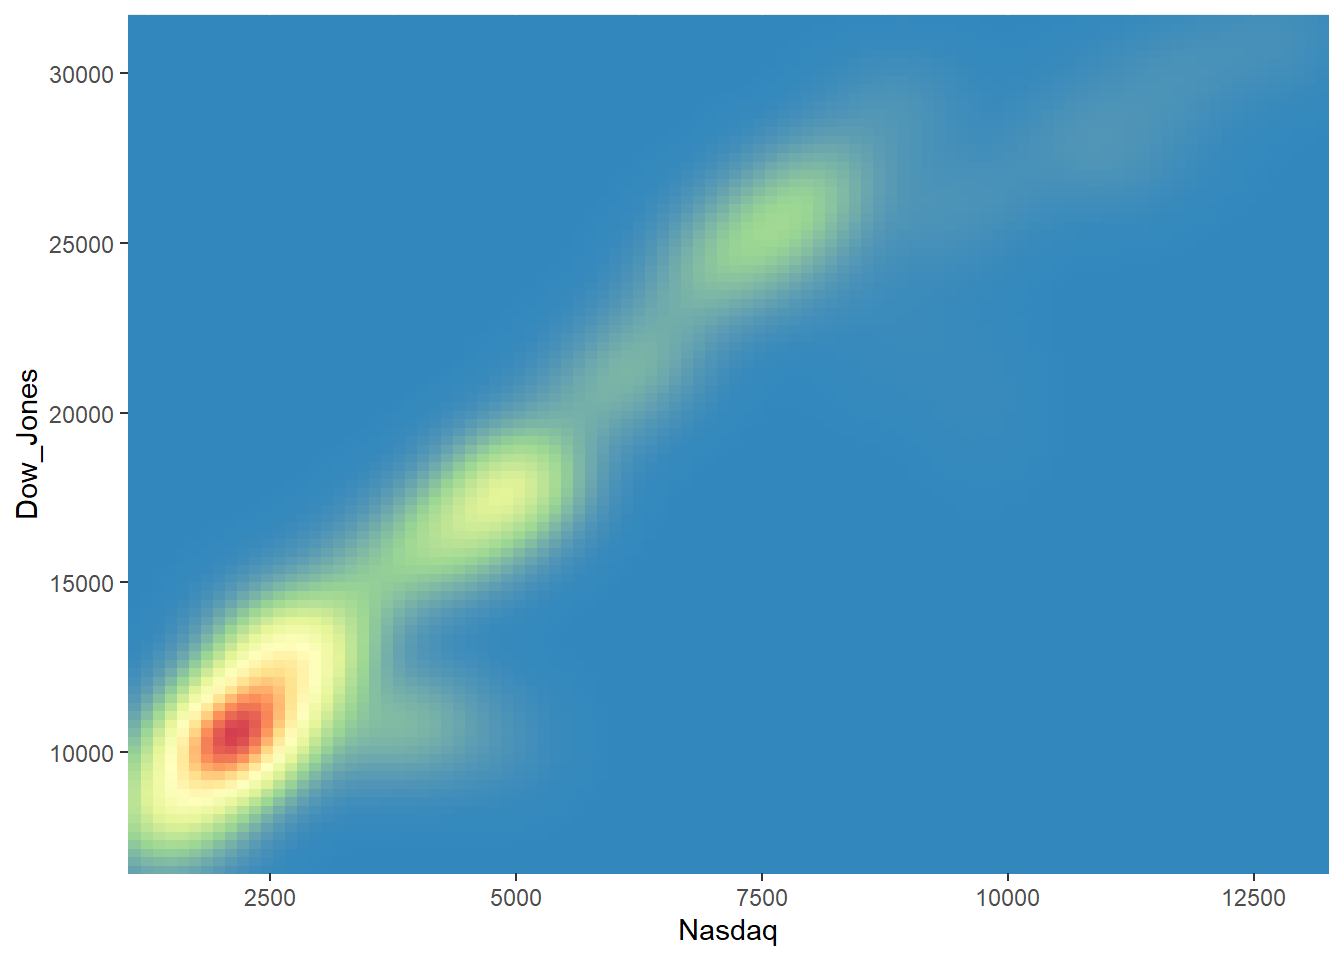
Though the Nasdaq Composite focuses on the cutting-edge technology sector and relatively avant-garde companies, its performance has still shown strong correlation to that of S&P 500.
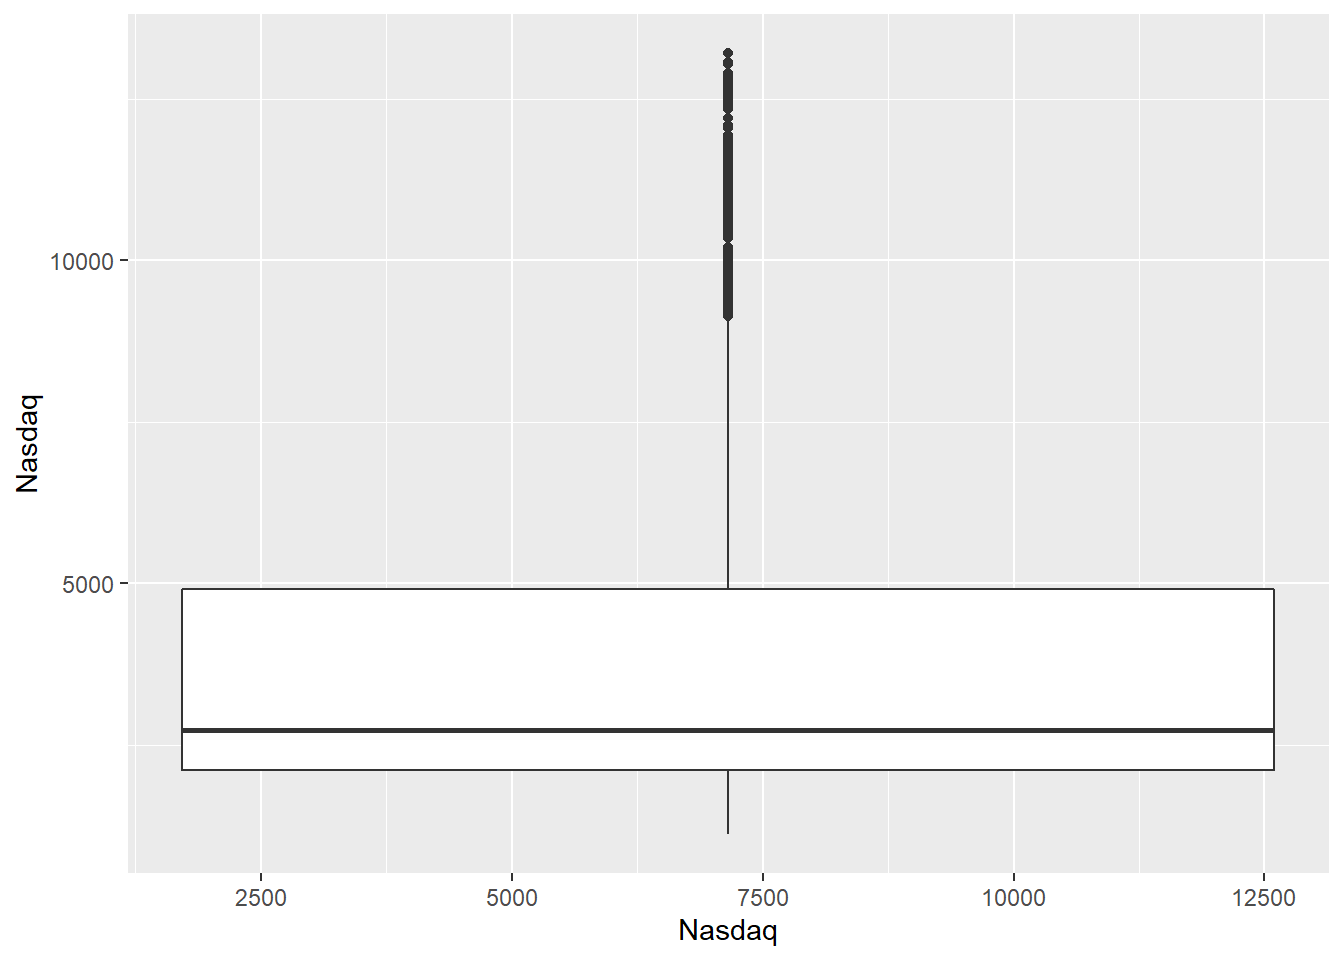
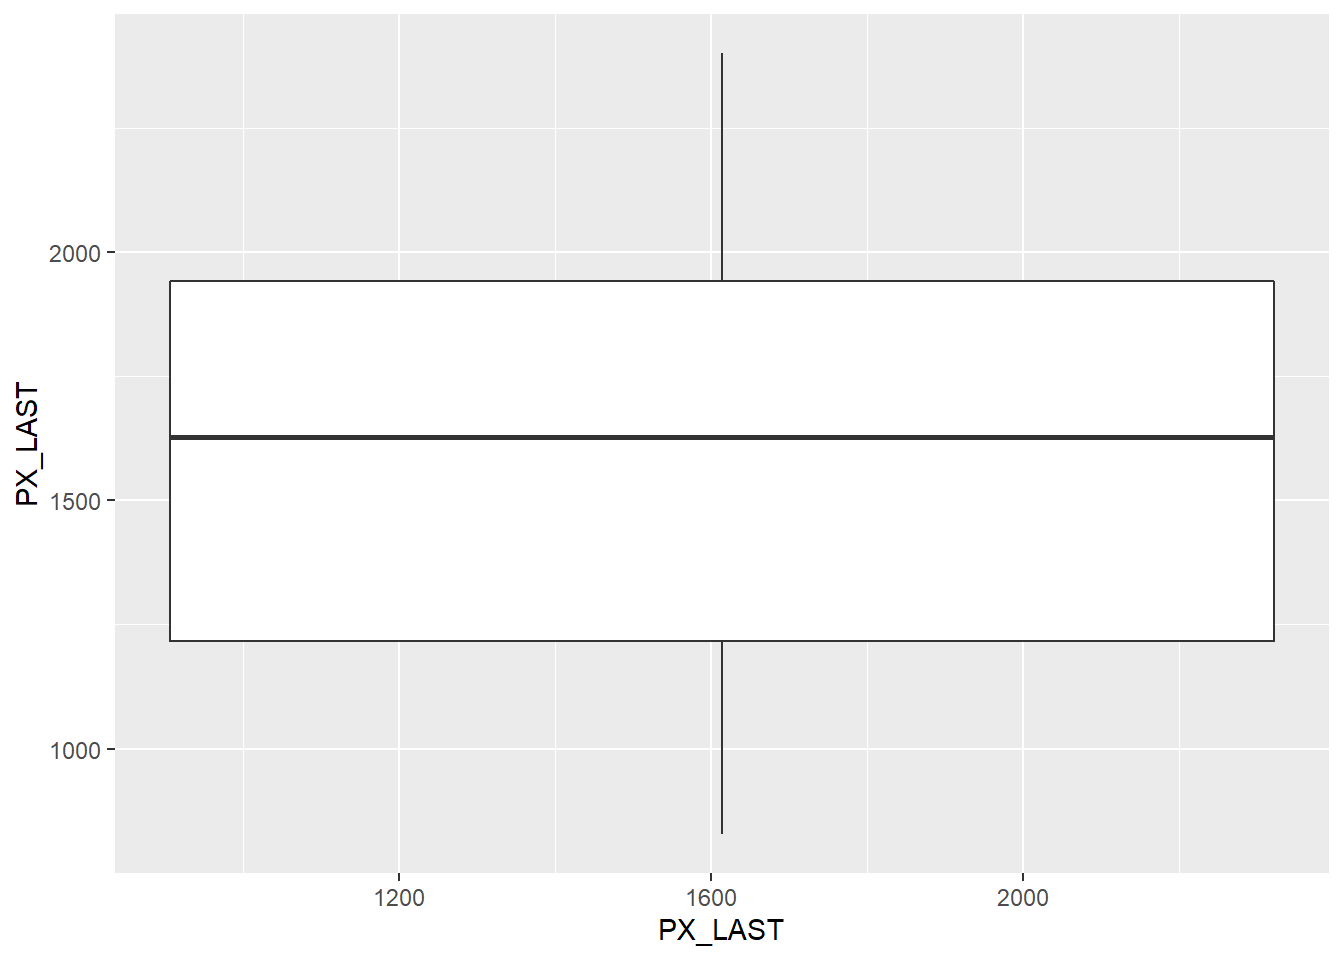
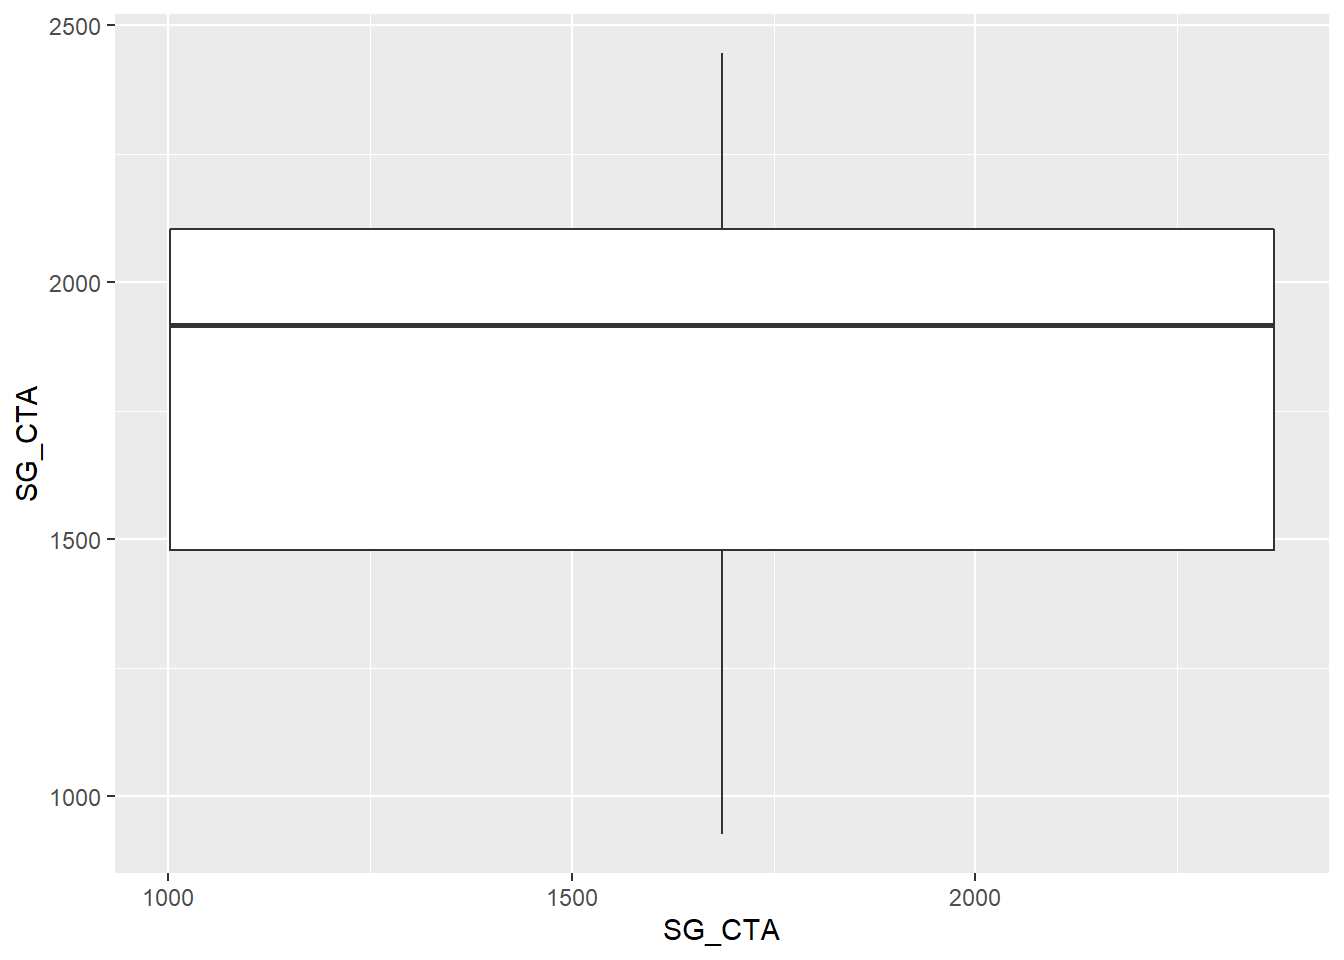
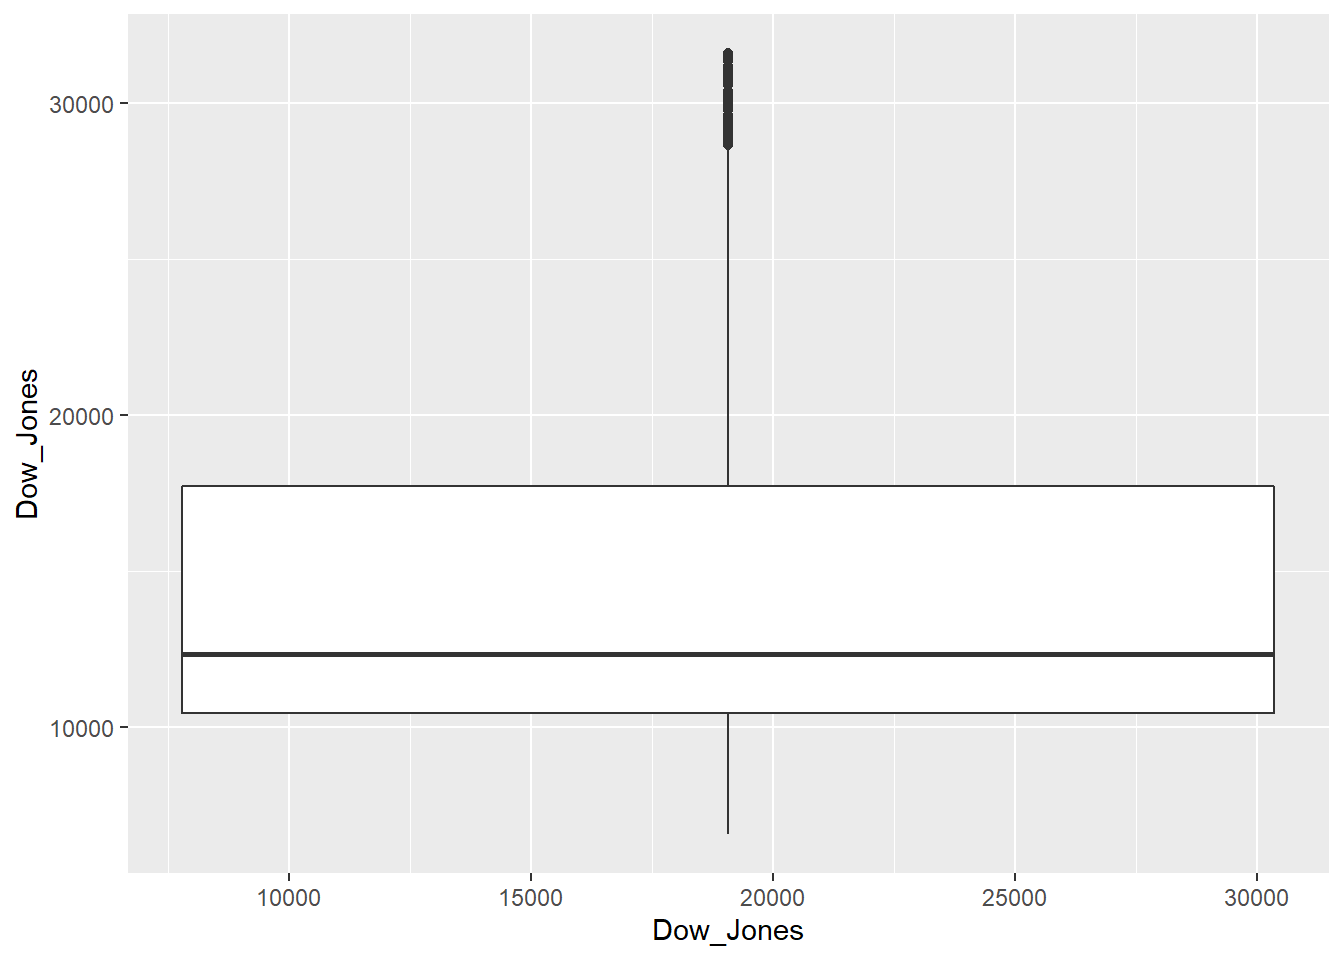
5.5 Boxplots for different Indexes
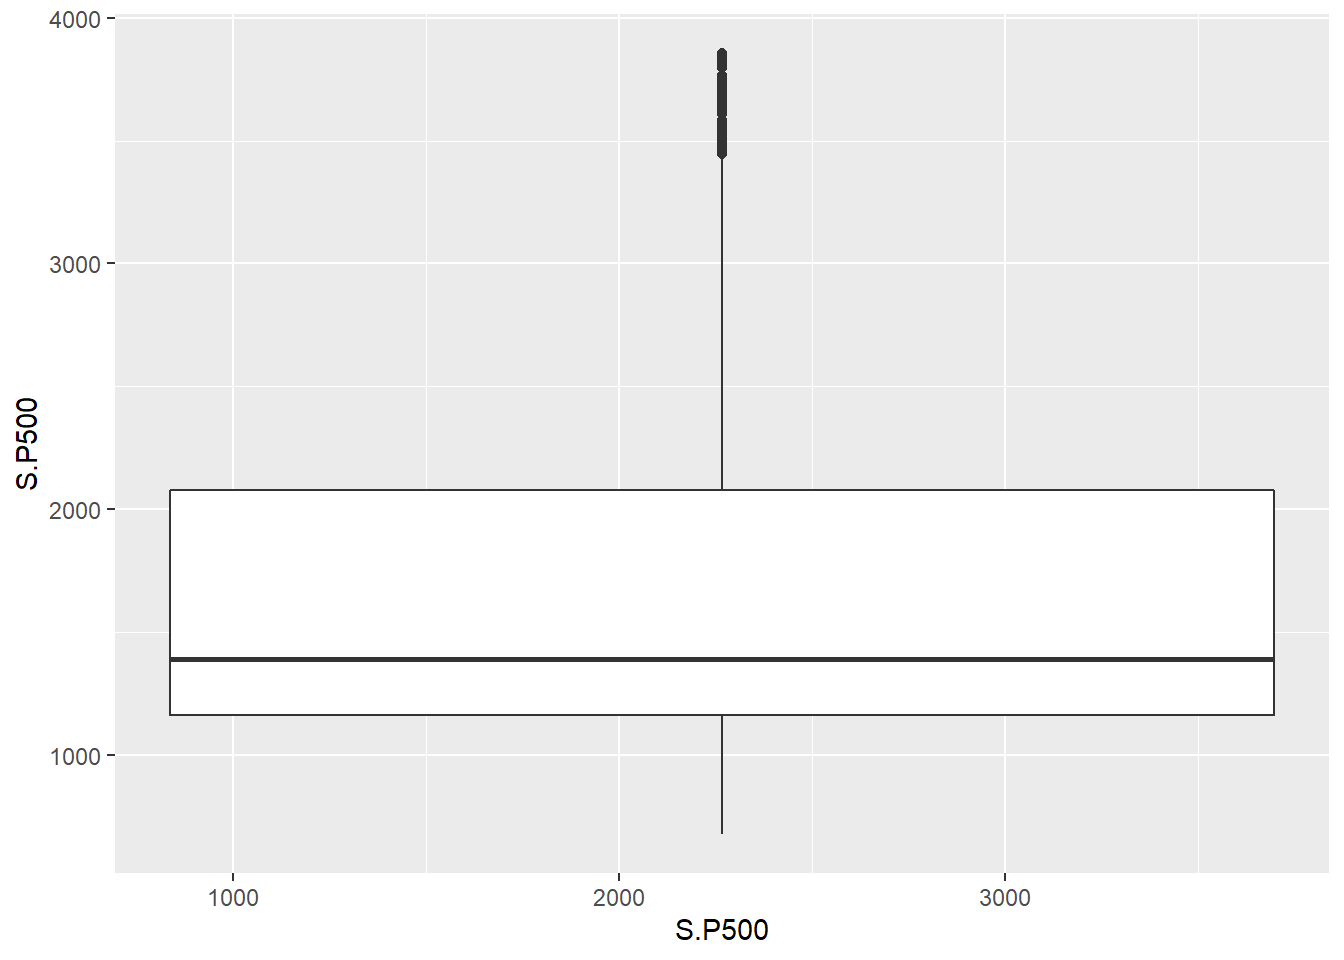
Boxplot summary:
As shown on the boxplot, three stock indexes have similar distribution with the mean relatively closer to the lower quartile compared to the upper quartile, while the CTA index shows the exact opposite behavior in terms of interquartile distribution. The higher mean provided by the CTA index in the boxplot could be attractive to investors, as it is suggested by the boxplot that an average investor could only obtain less than optimum returns (close to the lower quartile) by buying the stock indexes. The Bond index offers an evenly distributed inter-quartile range, as is reasonably presumed by its strong financial stability and low risk-related variance.