Chapter 4 Missing values
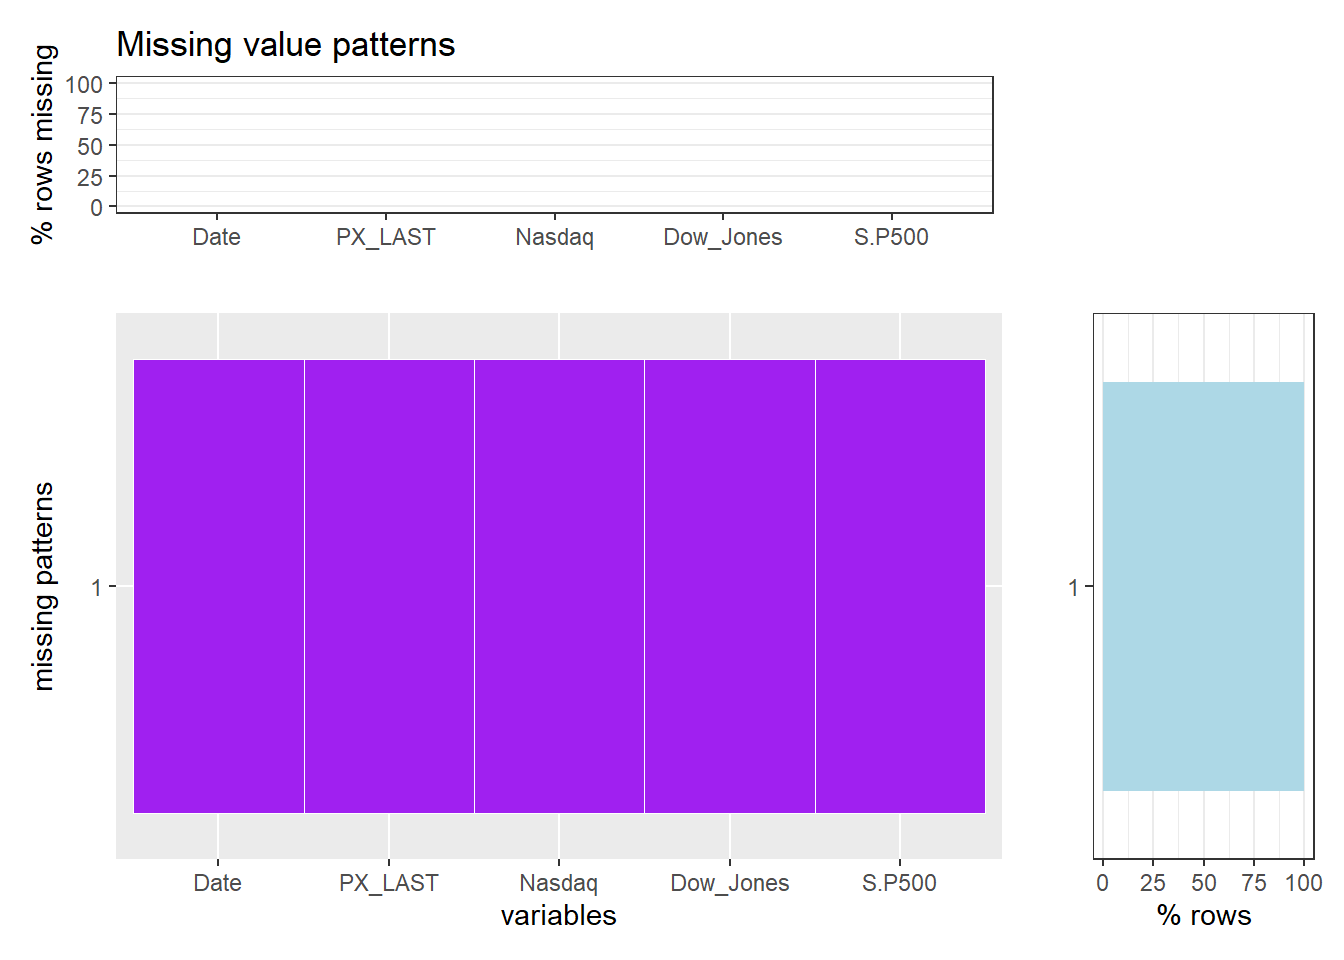
Because we want to explore the situation of the missing values in the data set, we expect to visualize the missing patterns of our data set. The columns represent five kinds of indexes, which are CTA (Commodity Trading Advisor) Index, S&P 500 Index, Nasdaq Composite Index, US Aggregate Bond Index, and Dow&Jones Industrial Average Index.

Columns 2-6 describes the categorization of different kinds of indexes we have utilized in the project. We want to use the function used for plotting the missing patterns to verify the situation of the missing patterns of these five main attributes. Based on the plot above, we can see that for all five kinds of indexes, there is no missing value pattern.
Columns 7-10 describes the categorization of different kinds of normalization results of indexes we have utilized in the project. We want to use the function used for plotting the missing patterns to verify the situation of the missing patterns of these five main attributes. Based on the plot above, we can see that for all five kinds of indexes, there is no missing value pattern.